CustomeFootprint
Human Behavior Map
Instructor: Panagiotis Michalatos, Nicholas Cassab
Tools: YOLO | CLIP | PYGLET | IMGUI
Time: 24Spring
The observation of human behavior in urban public space is vital for analyzing the social dynamics of cities and retrofitting urban infrastructure. However, traditional techniques of acquiring quantitative data on outdoor area usage have some limitations. Standard computer categorization methods can only detect pedestrian’s location and relative movement based on time series analysis, whereas manual counting and labeling approaches are both time-consuming and expensive. For user convenience and cost-effective urban spatial study, we developed CustomFootprint, a user-customized toolset for spatial evaluation, which draws behavior maps by combining human detection and further activity analysis via an objection detection model with a large language model.
Method
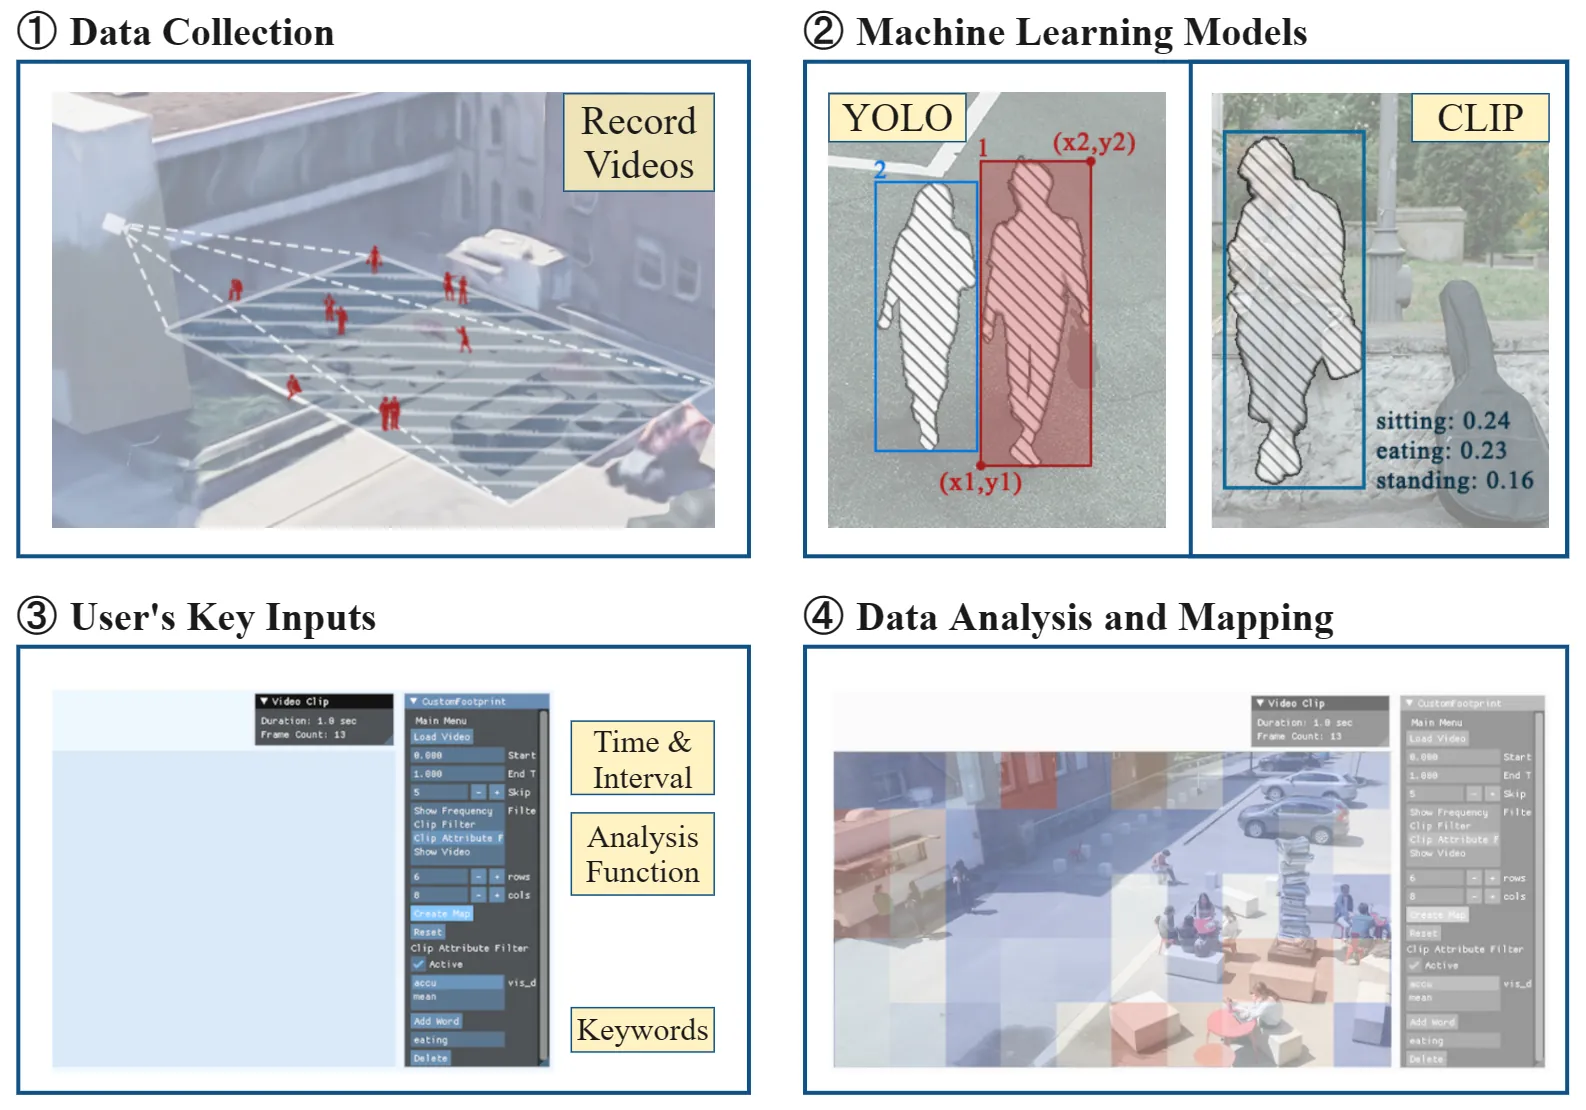
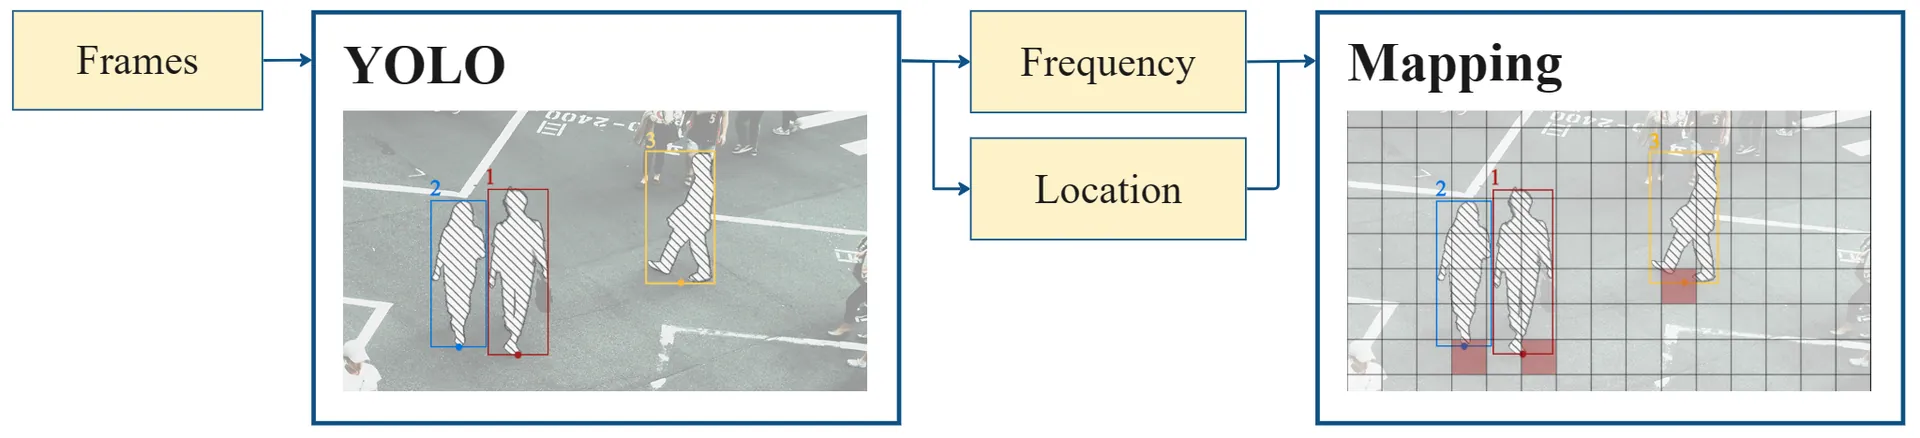
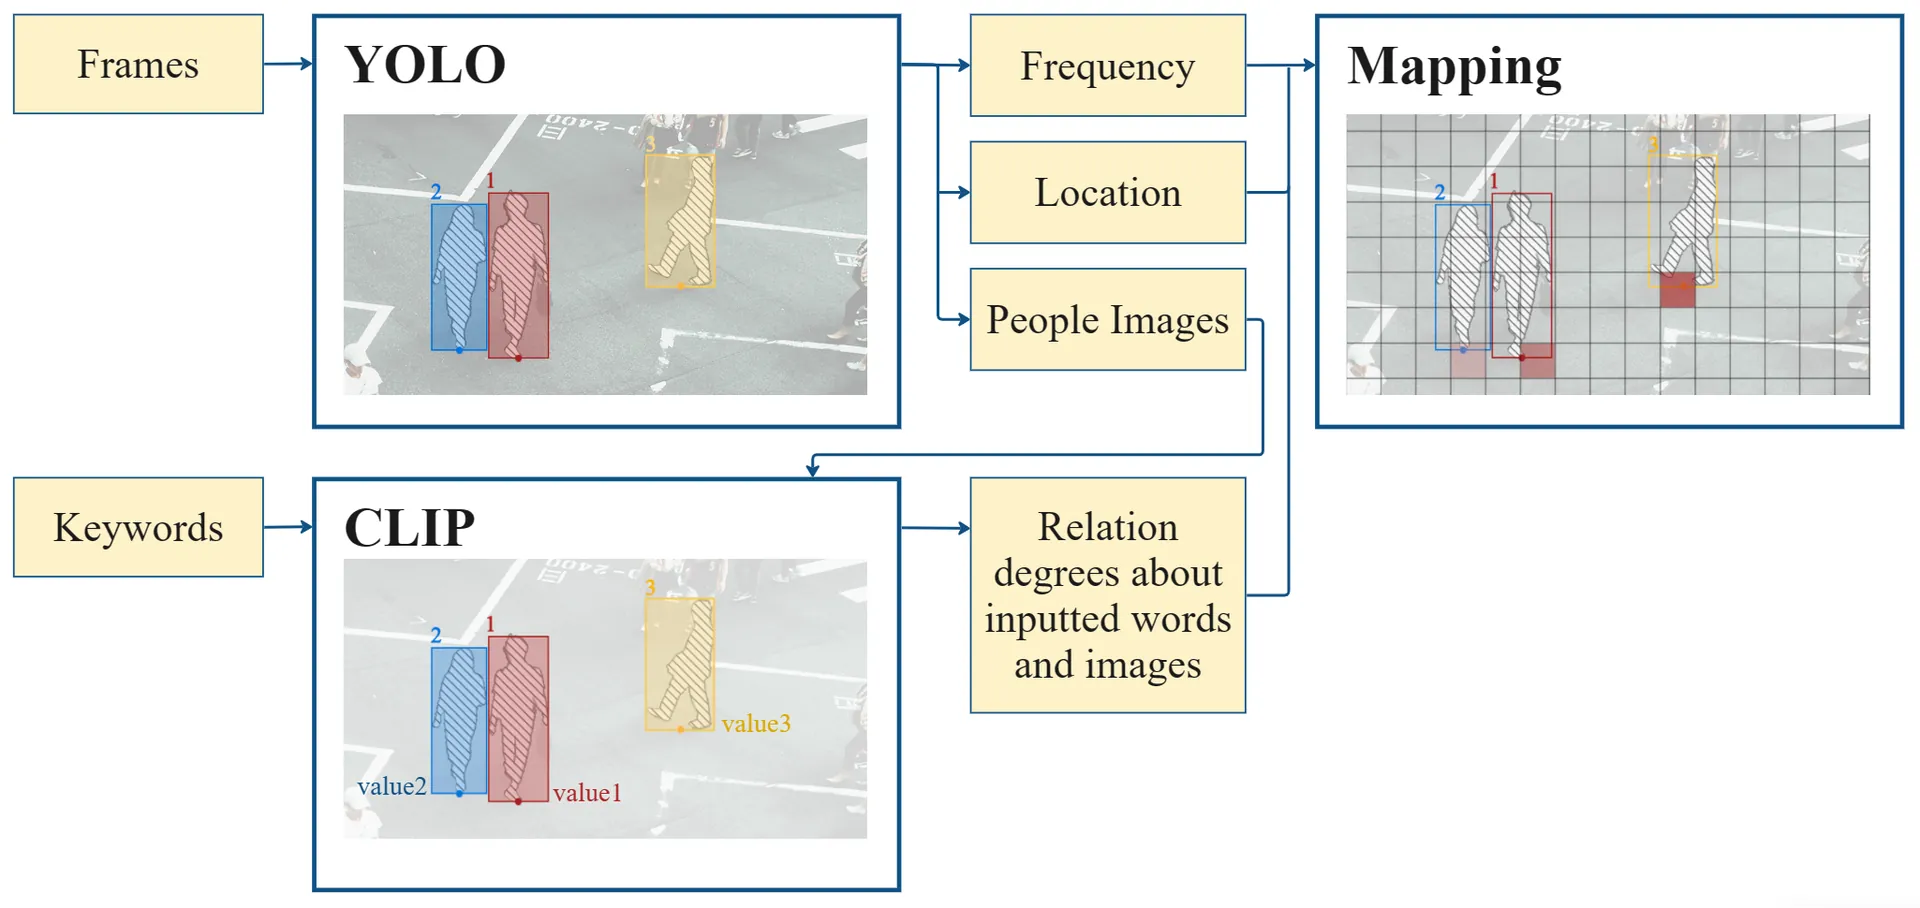
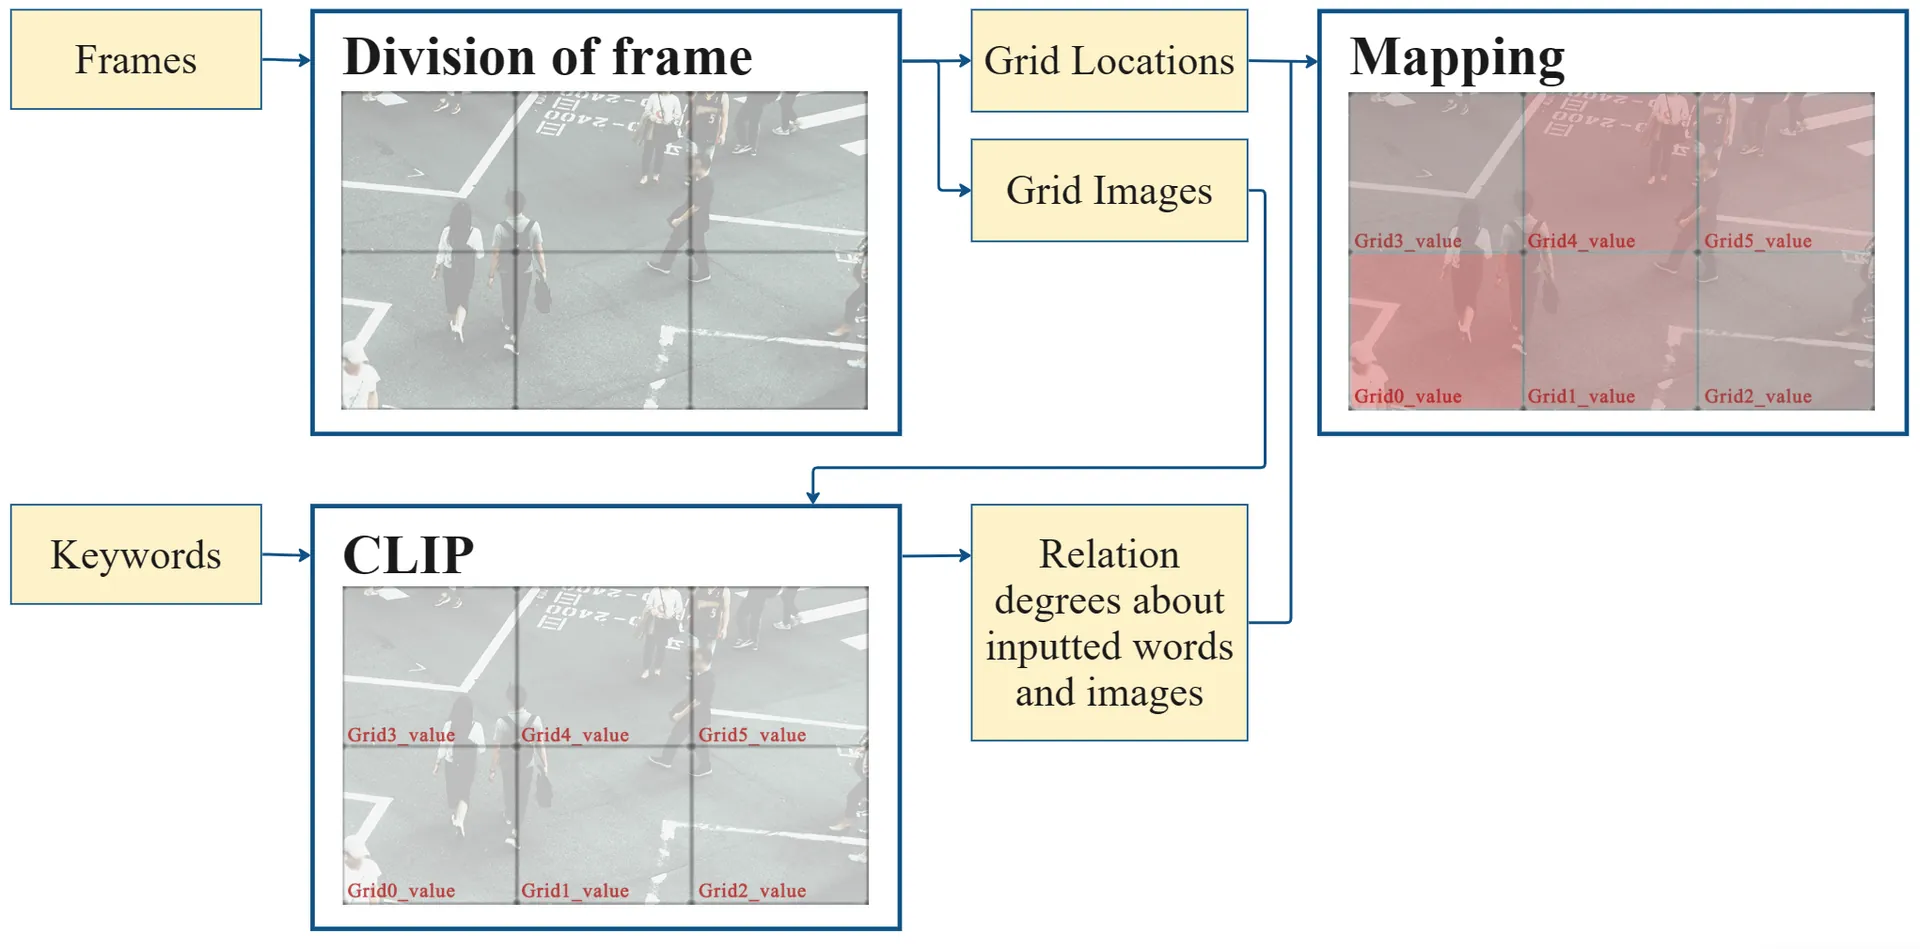
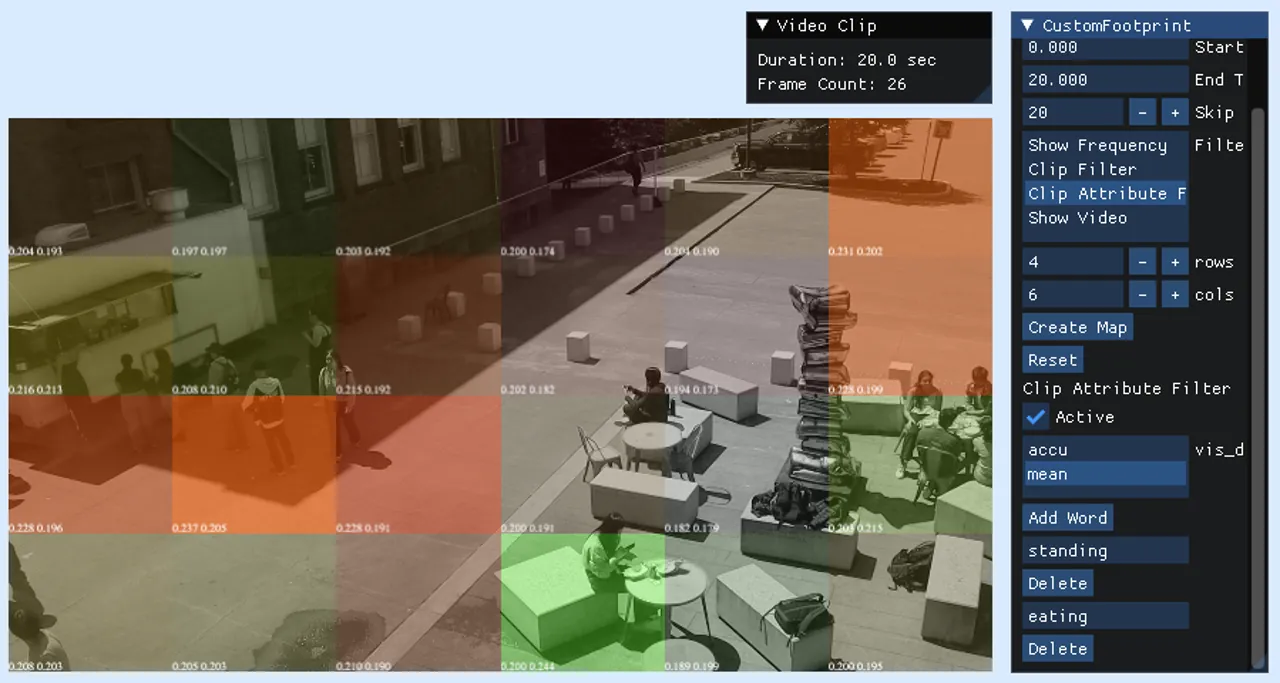
Based on machine learning models, we developed CustomFootprint, a toolkit that offers an intuitive interface for customizable urban area research by observing human presence and activities (Figure 1). Initially, pedestrian statistics are collected via video captured from designated site-specific angles. Each frame from the tape is used as input for further analysis. Utilizing two machine learning models, the YOLO one recognizes and tracks participants, extracting their position and other pertinent data inside the picture. Simultaneously, the CLIP model generates numerical assessments that indicate the degree of similarity between the input photos and chosen keywords. At last, the toolset combines these models and functionalities into an interface, enabling users to easily set different variables according to particular investigation goals, such as pedestrian frequency statistics and spatial distribution of various behaviors.
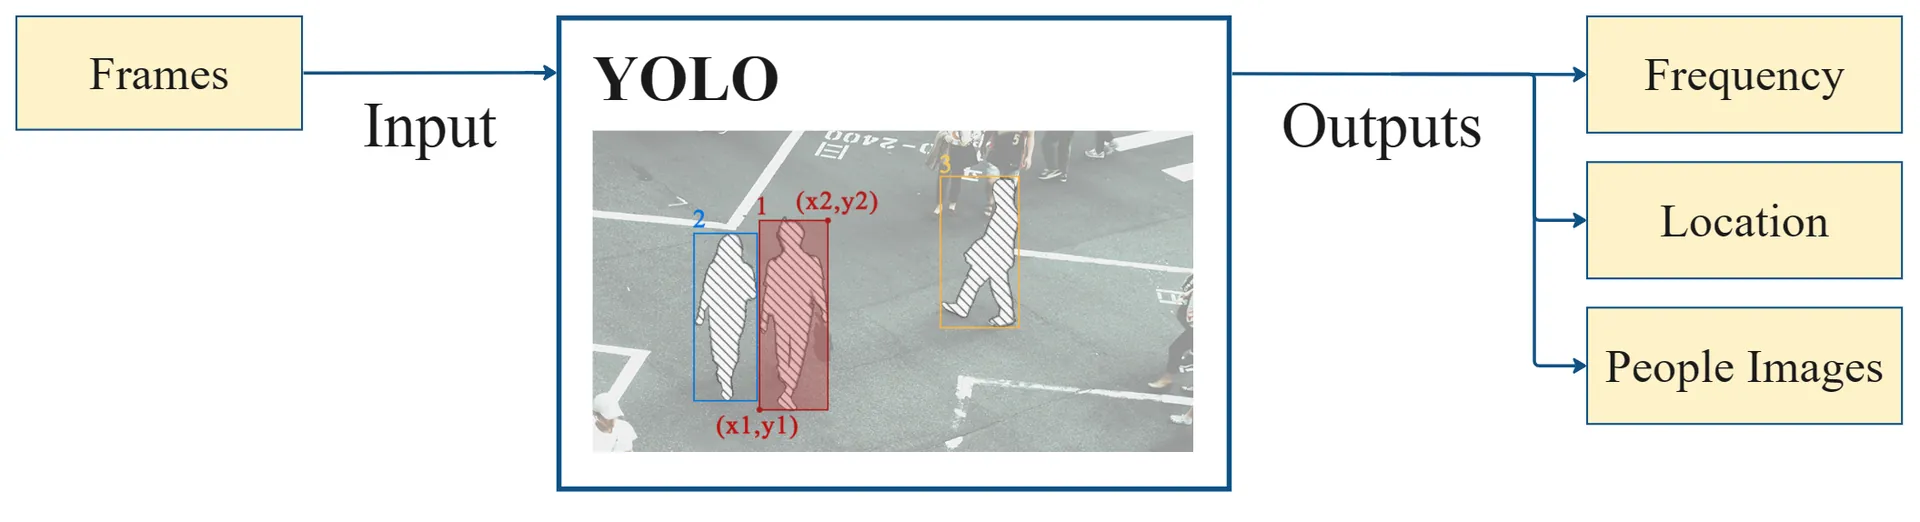
YOLO (You Only Look Once)
We utilize the advanced functionalities of the model to do pedestrian detection, obtaining data such as location, frequency, and bounding boxes of individuals. Specifically, we deploy YOLO v8 released by Ultralytics – the latest generation in the YOLO family. This version implements substantial enhancements in the architecture of networks, resulting in improved precision for outcomes as well as increased processing speed. [i] Such developments are vital for understanding human dynamics inside urban contexts.
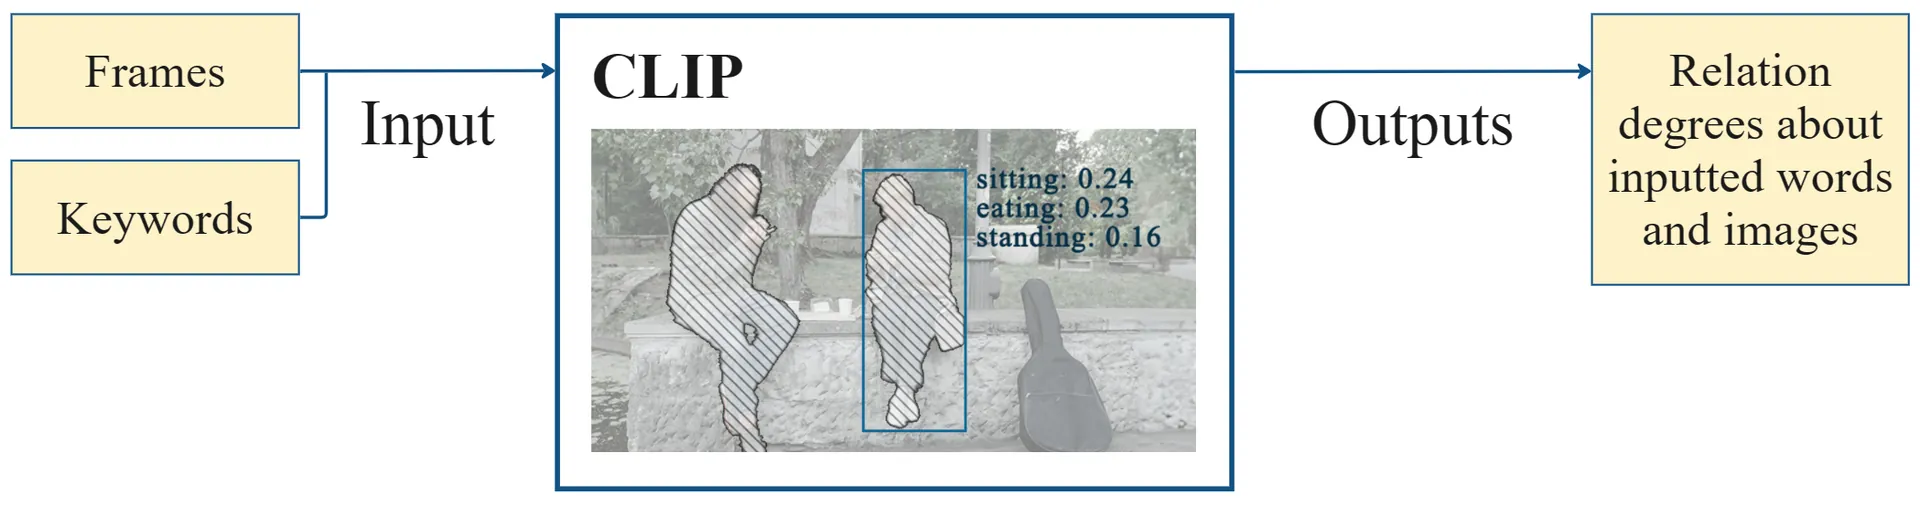
CLIP (Contrastive Language–Image Pre-training)
In the model, it learns to detect distinct notions in images and connects them with their sorting names. Therefore. A fundamental strength of CLIP is its high versatility, making it relevant to practically every visual classification problem. Researchers can simply input the name of the category they wish to identify, and the model delivers an assessment of its closeness to the specified goal benchmark. In our project, we used this property of the CLIP model, allowing users to tailor keywords according to their own needs, precisely for the behavioral areas they are inspecting. They then can obtain numerical values showing the degrees of correlation between video frames and keywords, permitting the quantitative measurement of behaviors at certain times and locations to study spatial usage and patterns of human activities.
Measure Human Behavior and Evaluate Urban Spaces on User’s Input
Spatial Occupancy Frequency
Employing the YOLO model, the position coordinates of humans appearing in each selected frame are acquired as data for display. The site is divided into a grid layout, and the total amount of persons within each square over the provided time is computed. Finally, the results are shown via the brightness of colors to signify varying degrees of occupancy.
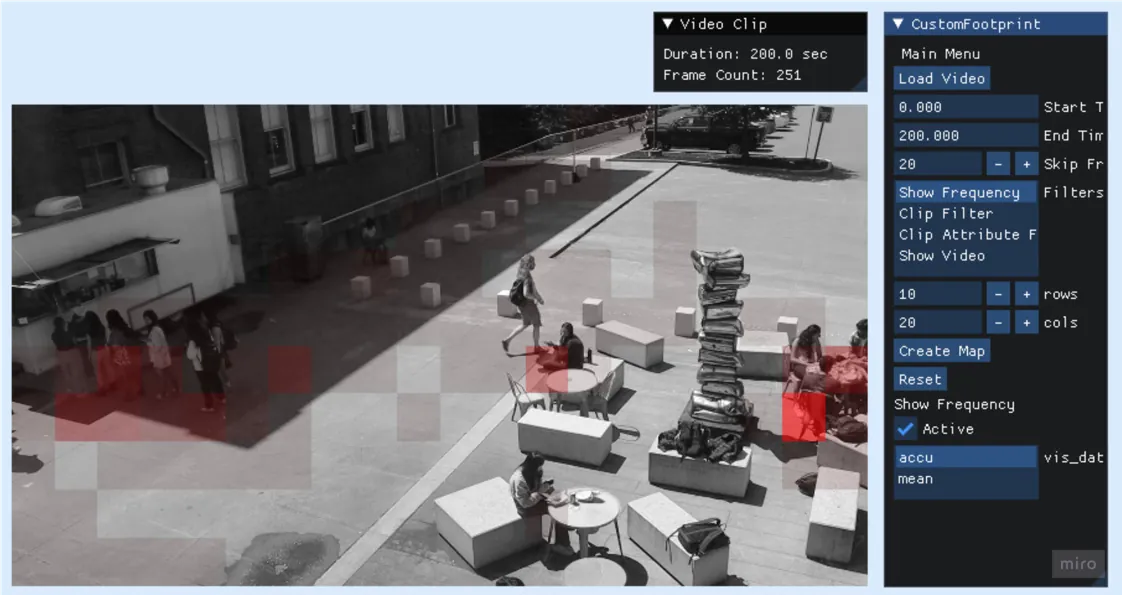
Initially, we conducted an analysis to determine the frequency at which individuals appeared inside a specific time frame (Figure7). The distribution exhibits great variation. In the waiting and dining areas of the food truck, the grid colors are notably brighter, indicating a higher frequency of people showing up in these regions compared to other parts. Conversely, the parts that are lighter in color mainly correspond to locations that act as passageways. The graphic effectively and precisely represents the distribution of individual in the chosen site within the selected video sections.
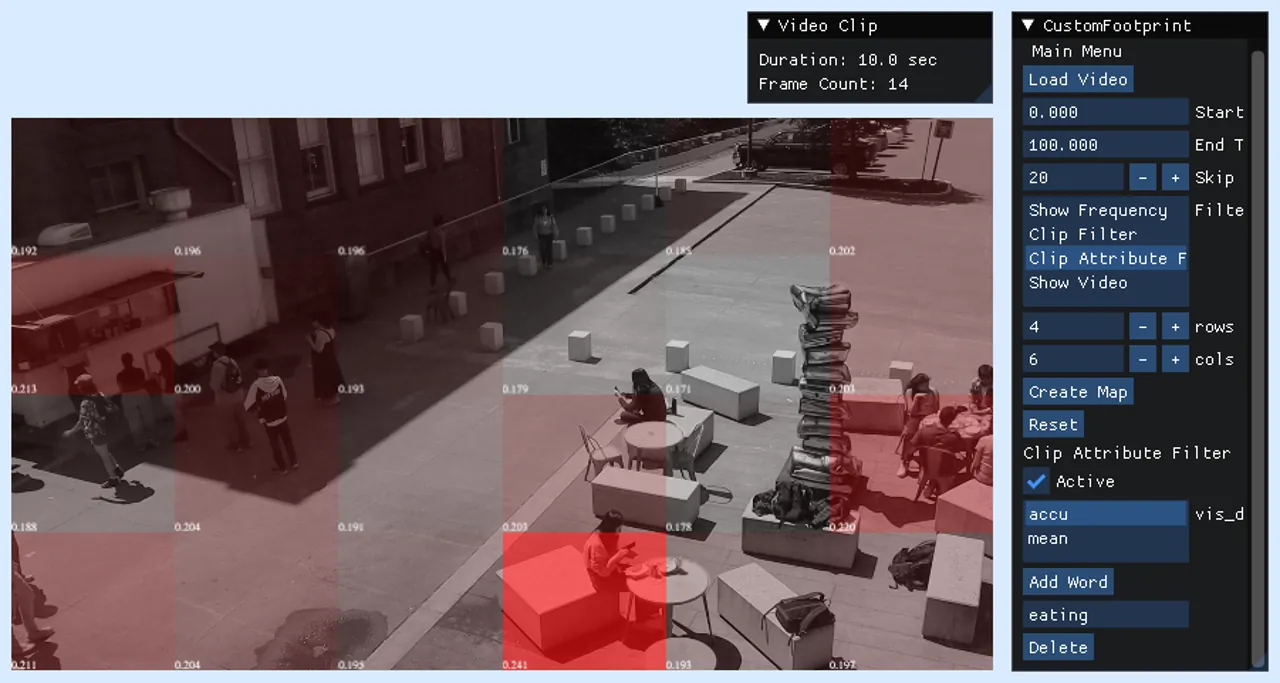
Distribution of CLIP Values for Persons and Specified Keywords
Employing the YOLO model, the position coordinates of humans appearing in each selected frame are acquired as data for display. The site is divided into a grid layout, and the total amount of persons within each square over the provided time is computed. Finally, the results are shown via the brightness of colors to signify varying degrees of occupancy.
Eating Distribution
Walking Distribution
Standing & Eating Distribution
Distribution of CLIP Values Across Designated Site Sections and Corresponding Keywords
Each site may intrinsically have functional zones defined during its design phase. To study if these zones genuinely attract distinct activities in reality, the site is split according to the viewing windows of the acquired video. The model determines the keyword alignment values for the related portions of the site in each frame and computes their average results. This study finally permits a comparison of behavioral features demonstrated across various locations of the region.
Eating Distribution
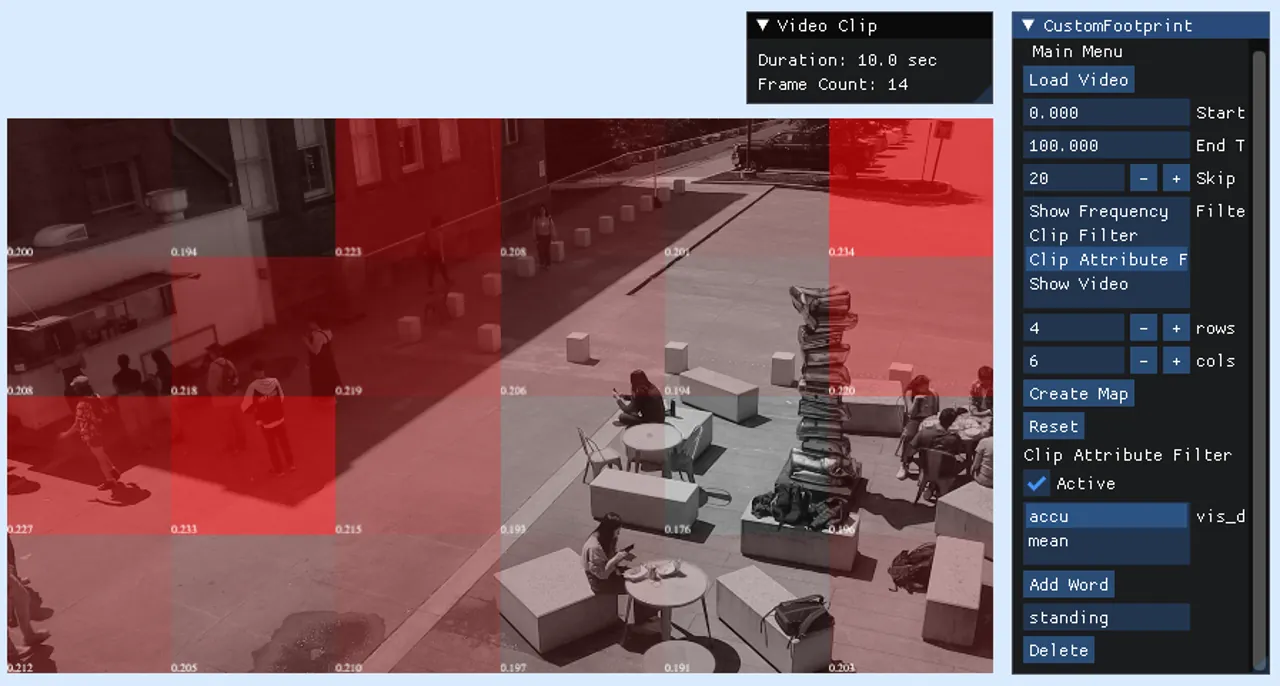
Standing Distribution
Standing & Eating Distribution